


Page 60
P. 60
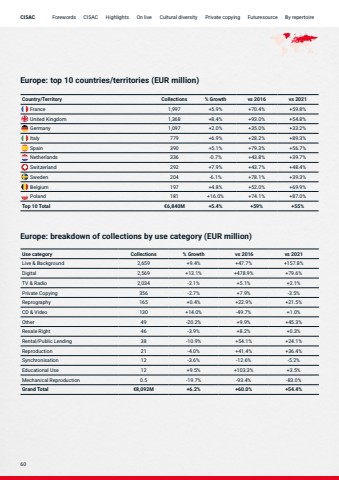
Use category Collections % Growth vs 2016 vs 2021Live & Background 2,659 +9.4% +47.7% +157.8%Digital 2,569 +13.1% +478.9% +79.6%TV & Radio 2,034 -2.1% +5.1% +2.1%Private Copying 356 -2.7% +7.9% -3.5%Reprography 165 +0.4% +22.9% +21.5%CD & Video 130 +14.0% -49.7% +1.0%Other 49 -20.2% +9.9% +45.3%Resale Right 46 -3.9% +8.2% +0.3%Rental/Public Lending 38 -10.9% +54.1% +24.1%Reproduction 21 -4.0% +41.4% +36.4%Synchronisation 12 -3.6% -12.6% -5.2%Educational Use 12 +9.5% +103.3% +3.5%Mechanical Reproduction 0.5 -19.7% -93.4% -83.0%Grand Total %u20ac8,092M +6.2% +60.0% +54.4%Europe: breakdown of collections by use category (EUR million)Country/Territory Collections % Growth vs 2016 vs 2021France 1,997 +5.9% +70.4% +59.8%United Kingdom 1,368 +8.4% +93.0% +54.8%Germany 1,097 +2.0% +35.0% +33.2%Italy 779 +6.9% +28.2% +89.3%Spain 390 +5.1% +79.3% +56.7%Netherlands 336 -0.7% +43.8% +39.7%Switzerland 292 +7.9% +43.7% +48.4%Sweden 204 -6.1% +78.1% +39.3%Belgium 197 +4.8% +52.0% +69.9%Poland 181 +16.0% +74.1% +87.0%Top 10 Total %u20ac6,840M +5.4% +59% +55%Europe: top 10 countries/territories (EUR million)60


