


Page 10
P. 10
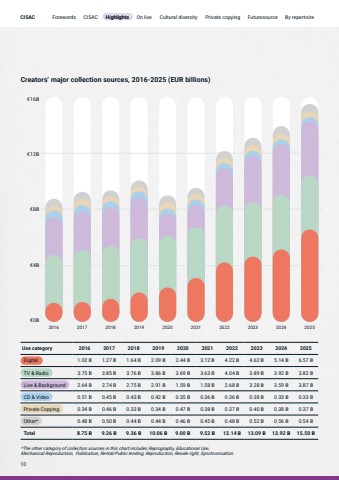
Creators%u2019 major collection sources, 2016-2025 (EUR billions)2016 2017 2018 2019 2020 2021 2022 2023 2024 2025%u20ac0B%u20ac4B%u20ac8B%u20ac12B%u20ac16B*The other category of collection sources in this chart includes Reprography, Educational Use, Mechanical Reproduction, Publication, Rental/Public lending, Reproduction, Resale right, Synchronisation.Use category 2016 2017 2018 2019 2020 2021 2022 2023 2024 2025Digital 1.02 B 1.27 B 1.64 B 2.09 B 2.44 B 3.12 B 4.22 B 4.62 B 5.14 B 6.57 BTV & Radio 3.75 B 3.85 B 3.76 B 3.86 B 3.69 B 3.63 B 4.04 B 3.89 B 3.92 B 3.82 BLive & Background 2.64 B 2.74 B 2.75 B 2.91 B 1.59 B 1.58 B 2.68 B 3.28 B 3.59 B 3.87 BCD & Video 0.51 B 0.45 B 0.43 B 0.42 B 0.35 B 0.36 B 0.36 B 0.38 B 0.33 B 0.33 BPrivate Copying 0.34 B 0.46 B 0.33 B 0.34 B 0.47 B 0.38 B 0.37 B 0.40 B 0.38 B 0.37 BOther* 0.48 B 0.50 B 0.44 B 0.44 B 0.46 B 0.45 B 0.48 B 0.52 B 0.56 B 0.54 BTotal 8.75 B 9.26 B 9.36 B 10.06 B 9.00 B 9.52 B 12.14 B 13.09 B 13.92 B 15.50 B10Highlights


