


Page 14
P. 14
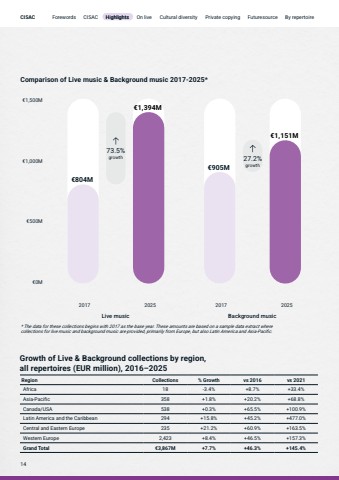
%u20ac0M%u20ac500M%u20ac1,000M%u20ac1,500M2017 2025 2017 2025Live music Background music%u20ac804M%u20ac905M%u20ac1,394M%u20ac1,151MComparison of Live music & Background music 2017-2025** The data for these collections begins with 2017 as the base year. These amounts are based on a sample data extract where collections for live music and background music are provided, primarily from Europe, but also Latin America and Asia-Pacific.Region Collections % Growth vs 2016 vs 2021Africa 18 -3.4% +8.7% +33.4%Asia-Pacific 358 +1.8% +20.2% +68.8%Canada/USA 538 +0.3% +65.5% +100.9%Latin America and the Caribbean 294 +15.8% +45.2% +477.0%Central and Eastern Europe 235 +21.2% +60.9% +163.5%Western Europe 2,423 +8.4% +46.5% +157.3%Grand Total %u20ac3,867M +7.7% +46.3% +145.4%Growth of Live & Background collections by region, all repertoires (EUR million), 2016%u2013202573.5%growth 27.2%growth14Highlights


