


Page 66
P. 66
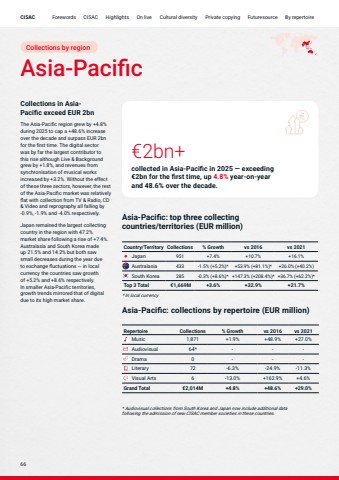
Asia-PacificCollections in AsiaPacific exceed EUR 2bnThe Asia-Pacific region grew by +4.8% during 2025 to cap a +48.6% increase over the decade and surpass EUR 2bn for the first time. The digital sector was by far the largest contributor to this rise although Live & Background grew by +1.8%, and revenues from synchronisation of musical works increased by +3.2%. Without the effect of these three sectors, however, the rest of the Asia-Pacific market was relatively flat with collection from TV & Radio, CD & Video and reprography all falling by -0.9%, -1.9% and -4.0% respectively.Japan remained the largest collecting country in the region with 47.2% market share following a rise of +7.4%. Australasia and South Korea made up 21.5% and 14.2% but both saw small decreases during the year due to exchange fluctuations %u2014 in local currency the countries saw growth of +5.2% and +8.6% respectively. In smaller Asia-Pacific territories, growth trends mirrored that of digital due to its high market share.%u20ac2bn+ collected in Asia-Pacific in 2025 %u2014 exceeding %u20ac2bn for the first time, up 4.8% year-on-year and 48.6% over the decade.Collections by regionCountry/Territory Collections % Growth vs 2016 vs 2021Japan 951 +7.4% +10.7% +16.1%Australasia 433 -1.5% (+5.2%)* +53.9% (+81.1%)* +26.0% (+40.2%)South Korea 285 -0.3% (+8.6%)* +147.3% (+208.4%)* +36.7% (+62.2%)*Top 3 Total %u20ac1,669M +3.6% +32.9% +21.7%Asia-Pacific: top three collecting countries/territories (EUR million)Repertoire Collections % Growth vs 2016 vs 2021Music 1,871 +1.9% +48.9% +27.0%Audiovisual 64* - - -Drama 0 - - -Literary 72 -6.3% -24.9% -11.3%Visual Arts 6 -13.0% +162.9% +4.6%Grand Total %u20ac2,014M +4.8% +48.6% +29.0%Asia-Pacific: collections by repertoire (EUR million)* In local currency* Audiovisual collections from South Korea and Japan now include additional data following the admission of new CISAC member societies in these countries.66


