
Page 31 - Demo
P. 31
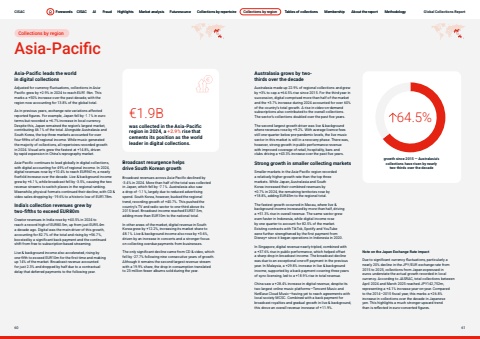
Page titleStandfirstBodyCollections by regionAsia-PacificAsia-Pacific leads the world in digital collectionsAdjusted for currency fluctuations, collections in AsiaPacific grew by +2.9% in 2024 to reach EUR1.9bn. This marks a +50% increase over the past decade, with the region now accounting for 13.8% of the global total.As in previous years, exchange rate variations affected reported figures. For example, Japan fell by -1.1% in euro terms but recorded a +6.7% increase in local currency. Despite this, Japan remained the region%u2019s largest market, contributing 46.1% of the total. Alongside Australasia and South Korea, the top three markets accounted for over four-fifths of all regional income. While music generated the majority of collections, all repertoires recorded growth in 2024. Visual arts grew the fastest at +14.8%, driven by rapid expansion in China%u2019s reprography market.Asia-Pacific continues to lead globally in digital collections, with digital accounting for 49% of regional income. In 2024, digital revenues rose by +10.4% to reach EUR941m, a nearly fivefold increase over the decade. Live & background income grew by +6.1%, while broadcast fell by -3.5%, causing the two revenue streams to switch places in the regional ranking. Meanwhile, physical formats continued their decline, with CD & video sales dropping by -19.6% to a historic low of EUR178m.India%u2019s collection revenues grew by two-fifths to exceed EUR80mCreator revenues in India rose by +40.5% in 2024 to reach a record high of EUR80.5m, up from just EUR5.4m a decade ago. Digital was the main driver of this growth, accounting for 82.7% of the total and rising by +56.7%, boosted by a significant back payment and the continued shift from free to subscription-based streaming.Live & background income also accelerated, rising by one-fifth to exceed EUR10m for the first time and making up 14% of the market. Broadcast revenue accounted for just 2.3% and dropped by half due to a contractual delay that deferred payments to the following year.%u20ac1.9B was collected in the Asia-Pacific region in 2024, a +2.9% rise that cements its position as the world leader in digital collections.Broadcast resurgence helps drive South Korean growthBroadcast revenues across Asia-Pacific declined by -3.4% in 2024. More than half of the total was collected in Japan, which fell by -7.1%. Australasia also saw a drop of -1.1%, largely due to reduced advertising spend. South Korea, however, bucked the regional trend, recording growth of +40.7%. This pushed the country%u2019s TV and radio sector to one-third above its 2015 level. Broadcast income reached EUR37.5m, adding more than EUR10m to the national total.In other areas of the market, digital revenue in South Korea grew by +12.2%, increasing its market share to 48.1%. Live & background income also rose by +3.6%, driven by an increase in concerts and a stronger focus on collecting overdue payments from businesses.The only significant decline came from CD & video, which fell by -27.7% following nine consecutive years of growth. Although it remains the second-largest revenue stream with a 19.9% share, the drop in consumption translated to 23 million fewer albums sold during the year.Australasia grows by twothirds over the decadeAustralasia made up 22.9% of regional collections and grew by +3% to cap a +64.5% rise since 2015. For the third year in succession, digital comprised more than half of the market and the +3.7% increase during 2024 accounted for over 60% of the country%u2019s total growth. A rise in video-on-demand subscriptions also contributed to the overall collections. The sector%u2019s collections doubled over the past five years.The second largest growth driver was live & background where revenues rose by +9.2%. With average licence fees still one-quarter below pre-pandemic levels, the live music sector in this market is still in a recovery phase. There was, however, strong growth in public performance revenue with improved coverage of retail, hospitality, bars and clubs driving a +43.3% increase over the past five years.Strong growth in smaller collecting marketsSmaller markets in the Asia-Pacific region recorded a relatively higher growth rate than the top three markets. While Japan, Australasia and South Korea increased their combined revenues by +0.7% in 2024, the remaining territories rose by +18.8%, adding EUR45m to the regional total.The fastest growth occurred in Macau, where live & background income increased by more than half, driving a +51.3% rise in overall revenue. The same sector grew even faster in Indonesia, while digital income rose by one quarter to account for 82.5% of the market. Existing contracts with TikTok, Spotify and YouTube were further strengthened by the first payment from Disney+ since it began operations in Indonesia in 2020.In Singapore, digital revenue nearly tripled, combined with a +37.6% rise in public performance, which helped offset a sharp drop in broadcast income. The broadcast decline was due to an exceptional one-off payment in the previous year. In Malaysia, a +29.8% increase in live & background income, supported by a back payment covering three years of sync licensing, led to a +18.9% rise in total revenue.China saw a +28.4% increase in digital revenue, despite its two largest online music platforms%u2014Tencent Music and NetEase Cloud Music%u2014having yet to reach agreements with local society MCSC. Combined with a back payment for broadcast royalties and gradual growth in live & background, this drove an overall revenue increase of +11.9%.growth since 2015 %u2014 Australasia%u2019s collections have risen by nearly two-thirds over the decade64.5%Note on the Japan Exchange Rate impactDue to significant currency fluctuations, particularly a nearly 20% decline in the JPY/EUR exchange rate from 2015 to 2025, collections from Japan expressed in euros understate the actual growth recorded in local currency. According to JASRAC, total collections between April 2024 and March 2025 reached JPY142,752m, representing a +4.1% increase year-on-year. Compared to the 2014%u20132015 fiscal year, this marks a +26.8% increase in collections over the decade in Japanese yen. This highlights a much stronger upward trend than is reflected in euro-converted figures.CISAC Forewords CISAC AI Fraud Highlights Market analysis Futuresource Collections by repertoire Collections by region Tables of collections Membership About the report Methodology60 61Forewords CISAC AI Fraud Highlights Market analysis Futuresource Collections by repertoire Collections by region Tables of collections Membership About the report Methodology Global Collections Report
