
Page 28 - Demo
P. 28
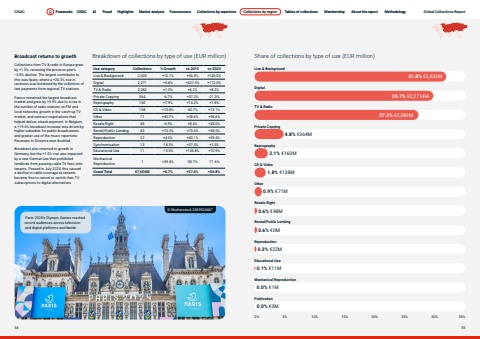
Page titleStandfirstBodyUse category Collections % Growth vs 2015 vs 2020Live & Background 2,433 +10.1% +36.3% +143.0%Digital 2,271 +9.8% +627.3% +112.0%TV & Radio 2,082 +1.5% +6.2% +8.3%Private Copying 364 -6.7% +37.2% -21.3%Reprography 160 +7.9% +14.2% +1.8%CD & Video 138 +13.8% -42.7% +12.1%Other 71 +45.7% +38.6% +98.6%Resale Right 48 -6.9% +8.4% +28.0%Rental/Public Lending 43 +13.3% +73.6% +38.5%Reproduction 22 +4.0% +40.1% +59.4%Synchronisation 13 -18.5% +37.4% +1.5%Educational Use 11 -15.0% +106.8% +10.9%Mechanical Reproduction 1 +39.4% -90.7% -71.6%Grand Total %u20ac7,656M +6.7% +57.6% +56.8%Broadcast returns to growth Breakdown of collections by type of use (EUR million)Collections from TV & radio in Europe grew by +1.5%, reversing the previous year%u2019s --3.8% decline. The largest contributor to this was Spain, where a +20.3% rise in revenues was bolstered by the collection of late payments from regional TV stations. France remained the largest broadcast market and grew by +3.9% due to a rise in the number of radio stations on FM and local networks, growth in the catch-up TV market, and contract negotiations that helped deliver a back payment. In Belgium, a +19.4% broadcast increase was driven by higher subsidies for public broadcasters and greater use of the music repertoire. Revenues in Slovenia near doubled. Broadcast also returned to growth in Germany, but the +1.5% rise was impacted by a new German law that prohibited landlords from passing cable TV fees onto tenants. Passed in July 2024, this caused a decline in cable coverage as tenants became free to cancel or switch their TV subscriptions to digital alternatives. %u00a9 Shutterstock 2499524467 Share of collections by type of use (EUR million)0% 5% 10% 15% 20% 25% 30% 35%Live & BackgroundTV & RadioReprographyOtherRental/Public LendingDigitalPrivate CopyingCD & VideoResale RightEducational UsePublicationMechanical ReproductionReproduction31.8% %u20ac2,433M 29.7% %u20ac2,2714M 27.2% %u20ac2,082M 4.8% %u20ac364M 2.1% %u20ac160M 1.8% %u20ac138M 0.9% %u20ac71M 0.6% %u20ac48M 0.6% %u20ac0M 0.3% %u20ac22M 0.1% %u20ac11M 0.0% %u20ac1M 0.0% %u20ac0M Paris 2024%u2019s Olympic Games reached record audiences across television and digital platforms worldwide.CISAC Forewords CISAC AI Fraud Highlights Market analysis Futuresource Collections by repertoire Collections by region Tables of collections Membership About the report Methodology54 55Forewords CISAC AI Fraud Highlights Market analysis Futuresource Collections by repertoire Collections by region Tables of collections Membership About the report Methodology Global Collections Report
