
Page 23 - Demo
P. 23
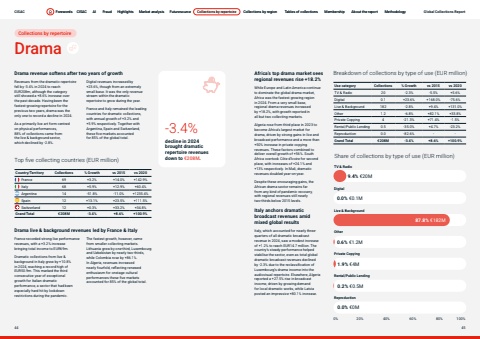
Page titleStandfirstBodyCollections by repertoireDrama-3.4%decline in 2024 brought dramatic repertoire revenues down to %u20ac208M.Drama revenue softens after two years of growth Africa%u2019s top drama market sees regional revenues rise +18.2%While Europe and Latin America continue to dominate the global drama market, Africa was the fastest growing region in 2024. From a very small base, regional drama revenues increased by +18.2%, with growth reported in all but two collecting markets.Algeria rose from third place in 2023 to become Africa%u2019s largest market for drama, driven by strong gains in live and broadcast performance and a more than +50% increase in private copying revenues. These factors combined to deliver overall growth of +56%. South Africa overtook C%u00f4te d%u2019Ivoire for second place, with increases of +24.1% and +13% respectively. In Mali, dramatic revenues doubled year-on-year.Despite these encouraging gains, the African drama sector remains far from any kind of pandemic recovery, with regional revenues still nearly two-thirds below 2015 levels.Italy anchors dramatic broadcast revenues amid mixed global resultsItaly, which accounted for nearly threequarters of all dramatic broadcast revenue in 2024, saw a modest increase of +1.2% to reach EUR14.7 million. The country%u2019s steady performance helped stabilise the sector, even as total global dramatic broadcast revenues declined by -2.3% due to the reclassification of Luxembourg%u2019s drama income into the audiovisual repertoire. Elsewhere, Algeria reported a +27.5% rise in broadcast income, driven by growing demand for local dramatic works, while Latvia posted an impressive +80.1% increase.Drama live & background revenues led by France & ItalyDigital revenues increased by +23.6%, though from an extremely small base. It was the only revenue stream within the dramatic repertoire to grow during the year. France and Italy remained the leading countries for dramatic collections, with annual growth of +3.2% and +5.9% respectively. Together with Argentina, Spain and Switzerland, these five markets accounted for 85% of the global total. The fastest growth, however, came from smaller collecting markets. Lithuania grew by one-third, Luxembourg and Uzbekistan by nearly two-thirds, while Colombia rose by +86.1%. In Algeria, revenues increased nearly fourfold, reflecting renewed enthusiasm for onstage cultural performances these five markets accounted for 85% of the global total. Revenues from the dramatic repertoire fell by -3.4% in 2024 to reach EUR208m, although the category still showed a +8.6% increase over the past decade. Having been the fastest-growing repertoire for the previous two years, drama was the only one to record a decline in 2024. As a primarily live art form centred on physical performances, 88% of collections came from the live & background sector, which declined by -2.8%. France recorded strong live performance revenues, with a +3.2% increase bringing total income to EUR69m. Dramatic collections from live & background in Italy grew by +10.8% in 2024, reaching a record high of EUR50.9m. This marked the third consecutive year of exceptional growth for Italian dramatic performance, a sector that had been especially hard hit by lockdown restrictions during the pandemic.Use category Collections % Growth vs 2015 vs 2020TV & Radio 20 -2.3% -5.5% +5.6%Digital 0.1 +23.6% +168.0% -75.6%Live & Background 182 -2.8% +9.4% +131.0%Other 1.2 -6.8% +82.1% +33.8%Private Copying 4 -21.3% +71.4% -1.5%Rental/Public Lending 0.5 -35.0% +4.7% -23.2%Reproduction 0.0 -82.6% - -Grand Total %u20ac208M -3.4% +8.6% +100.9%Breakdown of collections by type of use (EUR million)Share of collections by type of use (EUR million)0% 20% 40% 60% 80% 100%DigitalOtherRental/Public LendingTV & RadioLive & BackgroundPrivate CopyingReproduction9.4% %u20ac20M 0.0% %u20ac0.1M 0.6% %u20ac1.2M 1.9% %u20ac4M 0.2% %u20ac0.5M 0.0% %u20ac0M 87.8% %u20ac182M Country/Territory Collections % Growth vs 2015 vs 2020France 69 +3.2% +14.0% +142.9%Italy 68 +5.9% +12.9% +60.4%Argentina 14 -51.8% -11.0% +1235.4%Spain 12 +13.1% +23.5% +111.5%Switzerland 12 +0.3% +33.2% +34.8%Grand Total %u20ac208M -3.4% +8.6% +100.9%Top five collecting countries (EUR million) CISAC Forewords CISAC AI Fraud Highlights Market analysis Futuresource Collections by repertoire Collections by region Tables of collections Membership About the report Methodology44 45Forewords CISAC AI Fraud Highlights Market analysis Futuresource Collections by repertoire Collections by region Tables of collections Membership About the report Methodology Global Collections Report
