
Page 21 - Demo
P. 21
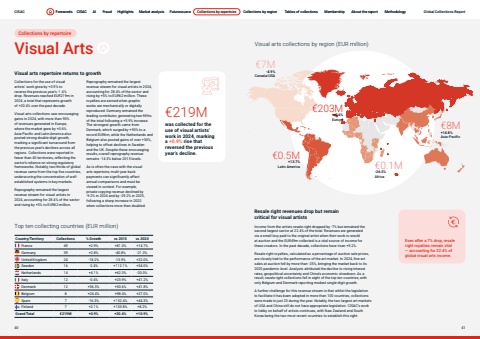
Page titleStandfirstBodyCollections by repertoireVisual arts repertoire returns to growthVisual ArtsReprography remained the largest revenue stream for visual artists in 2024, accounting for 28.4% of the sector and rising by +5% to EUR62 million. These royalties are earned when graphic works are mechanically or digitally reproduced. Germany remained the leading contributor, generating two-fifths of the total following a +3.9% increase. The strongest growth came from Denmark, which surged by +90% to a record EUR6m, while the Netherlands and Belgium also posted gains of over +50%, helping to offset declines in Sweden and the UK. Despite these encouraging results, overall reprography revenue remains -14.3% below 2015 levels. As is often the case with the visual arts repertoire, multi-year back payments can significantly affect annual comparisons and must be viewed in context. For example, private copying revenue declined by -9.2% in 2024 and by -29.2% in 2023, following a sharp increase in 2022 when collections more than doubled. Visual arts collections by region (EUR million)%u20ac0.5M+13.7%Latin America %u20ac0.1M-26.5%Africa%u20ac8M+14.8%Asia-Pacific%u20ac7M-4.9%Canada/USA%u20ac203M+0.6%EuropeResale right revenues drop but remain critical for visual artists Income from the artists resale right dropped by -7% but remained the second largest sector at 22.4% of the total. Revenues are generated via a small levy paid to the original artist when their work is resold at auction and the EUR49m collected is a vital source of income for these creators. In the past decade, collections have risen +9.2%. Resale right royalties, calculated as a percentage of auction sale prices, are closely tied to the performance of the art market. In 2024, fine-art sales at auction fell by more than -25%, bringing the market back to its 2020 pandemic level. Analysts attributed the decline to rising interest rates, geopolitical uncertainty and China%u2019s economic slowdown. As a result, resale right collections fell in eight of the top ten countries, with only Belgium and Denmark reporting modest single-digit growth. A further challenge for this revenue stream is that whilst the legislation to facilitate it has been adopted in more than 100 countries, collections were made in just 23 during the year. Notably, the two largest art markets of USA and China still do not have appropriate legislation. CISAC%u2019s work to lobby on behalf of artists continues, with New Zealand and South Korea being the two most recent countries to establish this right. Even after a 7% drop, resale right royalties remain vital %u2014 accounting for 22.4% of global visual arts income.%u20ac219Mwas collected for the use of visual artists%u2019 work in 2024, marking a +0.9% rise that reversed the previous year%u2019s decline.Collections for the use of visual artists%u2019 work grew by +0.9% to reverse the previous year%u2019s -1.4% drop. Revenues reached EUR219m in 2024, a total that represents growth of +20.4% over the past decade. Visual arts collections saw encouraging gains in 2024, with more than 90% of revenues generated in Europe, where the market grew by +0.6%. Asia-Pacific and Latin America also posted strong double-digit growth, marking a significant turnaround from the previous year%u2019s declines across all regions. Collections were reported in fewer than 40 territories, reflecting the sector%u2019s reliance on strong regulatory frameworks. Notably, two-thirds of global revenue came from the top five countries, underscoring the concentration of wellestablished systems in key markets. Reprography remained the largest revenue stream for visual artists in 2024, accounting for 28.4% of the sector and rising by +5% to EUR62 million. Country/Territory Collections % Growth vs 2015 vs 2020France 49 +2.9% +81.0% +14.7%Germany 39 +2.8% -40.8% -21.3%United Kingdom 24 -18.2% -13.9% +22.0%Sweden 16 -2.4% +112.1% +34.0%Netherlands 14 +4.1% +62.3% -20.0%Italy 12 -0.4% +23.9% +41.2%Denmark 12 +36.3% +50.6% +41.8%Belgium 8 +24.4% +98.4% +27.0%Spain 7 -16.3% +152.4% +44.3%Finland 7 +2.1% +103.8% +8.2%Grand Total %u20ac219M +0.9% +20.4% +10.9%Top ten collecting countries (EUR million) CISAC Forewords CISAC AI Fraud Highlights Market analysis Futuresource Collections by repertoire Collections by region Tables of collections Membership About the report Methodology40 41Forewords CISAC AI Fraud Highlights Market analysis Futuresource Collections by repertoire Collections by region Tables of collections Membership About the report Methodology Global Collections Report
