
Page 22 - Demo
P. 22
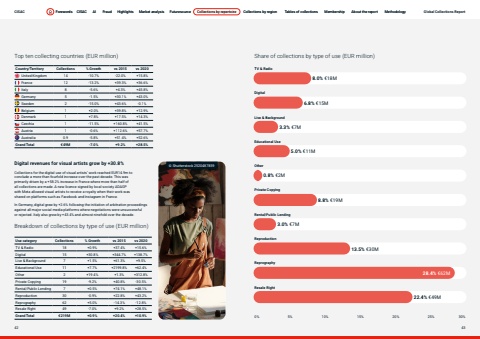
Page titleStandfirstBodyDigital revenues for visual artists grow by +30.8%Collections for the digital use of visual artists%u2019 work reached EUR14.9m to conclude a more than fourfold increase over the past decade. This was primarily driven by a +58.2% increase in France where more than half of all collections are made. A new licence signed by local society ADAGP with Meta allowed visual artists to receive a royalty when their work was shared on platforms such as Facebook and Instagram in France. In Germany, digital grew by +2.6% following the initiation of arbitration proceedings against all major social media platforms where negotiations were unsuccessful or rejected. Italy also grew by +43.4% and almost ninefold over the decade. Use category Collections % Growth vs 2015 vs 2020TV & Radio 18 +0.9% +37.4% +15.6%Digital 15 +30.8% +344.7% +138.7%Live & Background 7 +1.5% +61.3% +9.5%Educational Use 11 +7.7% +2199.8% +62.4%Other 2 +19.4% +1.3% +312.8%Private Copying 19 -9.2% +40.8% -30.5%Rental/Public Lending 7 +0.5% +74.1% +48.1%Reproduction 30 -0.9% +22.8% +43.2%Reprography 62 +5.0% -14.3% -12.8%Resale Right 49 -7.0% +9.2% +28.5%Grand Total %u20ac219M +0.9% +20.4% +10.9%Breakdown of collections by type of use (EUR million)%u00a9 Shutterstock 2520487859 Share of collections by type of use (EUR million)0% 5% 10% 15% 20% 25% 30%TV & RadioLive & BackgroundOtherRental/Public LendingReprographyDigitalEducational UsePrivate CopyingReproductionResale Right8.0% %u20ac18M 6.8% %u20ac15M 3.3% %u20ac7M 5.0% %u20ac11M 0.8% %u20ac2M 8.8% %u20ac19M 3.0% %u20ac7M 13.5% %u20ac30M 22.4% %u20ac49M 28.4% %u20ac62M Country/Territory Collections % Growth vs 2015 vs 2020United Kingdom 14 -10.7% -22.0% +15.8%France 12 -13.2% +39.3% +36.6%Italy 8 -5.6% +4.3% +45.8%Germany 5 -1.5% +30.1% +43.0%Sweden 2 -15.0% +43.6% -0.1%Belgium 1 +2.0% +39.8% +12.9%Denmark 1 +7.8% +17.5% +14.3%Czechia 1 -11.5% +160.8% +41.5%Austria 1 -0.6% +112.6% +57.7%Australia 0.9 -5.8% +51.4% +52.6%Grand Total %u20ac49M -7.0% +9.2% +28.5%Top ten collecting countries (EUR million) CISAC Forewords CISAC AI Fraud Highlights Market analysis Futuresource Collections by repertoire Collections by region Tables of collections Membership About the report Methodology42 43Forewords CISAC AI Fraud Highlights Market analysis Futuresource Collections by repertoire Collections by region Tables of collections Membership About the report Methodology Global Collections Report
