
Page 25 - Demo
P. 25
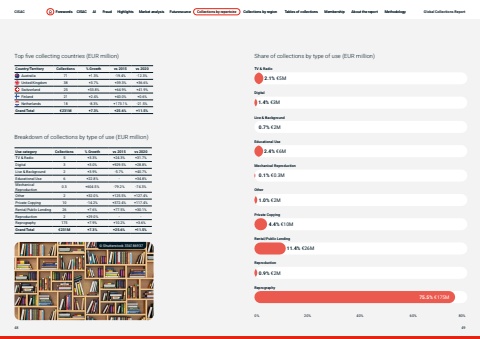
Page titleStandfirstBodyUse category Collections % Growth vs 2015 vs 2020TV & Radio 5 +3.3% +24.3% +31.7%Digital 3 +3.0% +929.5% +28.8%Live & Background 2 +3.9% -5.7% +40.7%Educational Use 6 +22.8% - +34.8%Mechanical Reproduction 0.3 +604.5% -79.2% -74.3%Other 2 +32.0% +125.5% +127.4%Private Copying 10 -14.2% +372.4% +117.4%Rental/Public Lending 26 +7.6% +77.5% +30.1%Reproduction 2 +29.0% - -Reprography 175 +7.9% +10.2% +3.6%Grand Total %u20ac231M +7.3% +25.6% +11.5%Breakdown of collections by type of use (EUR million)%u00a9 Shutterstock 334186937 Share of collections by type of use (EUR million)0% 20% 40% 60% 80%TV & RadioLive & BackgroundMechanical ReproductionPrivate CopyingReproductionDigitalEducational UseOtherRental/Public LendingReprography2.1% %u20ac5M 1.4% %u20ac3M 0.7% %u20ac2M 2.4% %u20ac6M 0.1% %u20ac0.3M 1.0% %u20ac2M 4.4% %u20ac10M 11.4% %u20ac26M 0.9% %u20ac2M 75.5% %u20ac175M Country/Territory Collections % Growth vs 2015 vs 2020Australia 71 +1.3% -19.4% -12.3%United Kingdom 38 +3.7% +39.3% +36.6%Switzerland 25 +33.8% +64.9% +41.9%Finland 21 +2.4% +40.0% +0.6%Netherlands 18 -8.3% +173.1% -21.5%Grand Total %u20ac231M +7.3% +25.6% +11.5%Top five collecting countries (EUR million) CISAC Forewords CISAC AI Fraud Highlights Market analysis Futuresource Collections by repertoire Collections by region Tables of collections Membership About the report Methodology48 49Forewords CISAC AI Fraud Highlights Market analysis Futuresource Collections by repertoire Collections by region Tables of collections Membership About the report Methodology Global Collections Report
