
Page 20 - Demo
P. 20
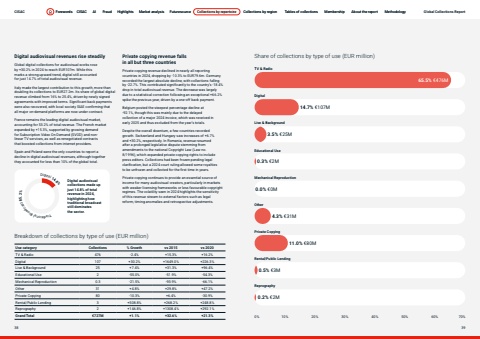
Page titleStandfirstBodyDigital audiovisual revenues rise steadilyGlobal digital collections for audiovisual works rose by +30.2% in 2024 to reach EUR107m. While this marks a strong upward trend, digital still accounted for just 14.7% of total audiovisual revenue.Italy made the largest contribution to this growth, more than doubling its collections to EUR27.2m. Its share of global digital revenue climbed from 16% to 25.4%, driven by newly signed agreements with improved terms. Significant back payments were also recovered, with local society SIAE confirming that all major on-demand platforms are now under contract.France remains the leading digital audiovisual market, accounting for 53.2% of total revenue. The French market expanded by +15.3%, supported by growing demand for Subscription Video On Demand (SVOD) and nonlinear TV services, as well as renegotiated contracts that boosted collections from internet providers.Spain and Poland were the only countries to report a decline in digital audiovisual revenues, although together they accounted for less than 10% of the global total.Private copying revenue falls in all but three countriesPrivate copying revenue declined in nearly all reporting countries in 2024, dropping by -10.3% to EUR79.6m. Germany recorded the largest absolute decline, with collections falling by -22.7%. This contributed significantly to the country%u2019s -18.4% drop in total audiovisual revenue. The decrease was largely due to a statistical correction following an exceptional +66.2% spike the previous year, driven by a one-off back payment.Belgium posted the steepest percentage decline at -92.1%, though this was mainly due to the delayed collection of a major 2024 invoice, which was received in early 2025 and thus excluded from the year%u2019s totals.Despite the overall downturn, a few countries recorded growth. Switzerland and Hungary saw increases of +6.7% and +30.2%, respectively. In Romania, revenue resumed after a prolonged legislative dispute stemming from amendments to the national Copyright Law (Law no. 8/1996), which expanded private copying rights to include press editors. Collections had been frozen pending legal clarification, but a 2024 court ruling allowed some royalties to be unfrozen and collected for the first time in years.Private copying continues to provide an essential source of income for many audiovisual creators, particularly in markets with weaker licensing frameworks or less favourable copyright regimes. The volatility seen in 2024 highlights the sensitivity of this revenue stream to external factors such as legal reform, timing anomalies and retrospective adjustments.Share of collections by type of use (EUR million)0% 10% 20% 30% 40% 50% 60% 70%TV & RadioLive & BackgroundMechanical ReproductionPrivate CopyingReprographyDigitalEducational UseOtherRental/Public LendingBreakdown of collections by type of use (EUR million)Use category Collections % Growth vs 2015 vs 2020TV & Radio 476 -2.4% +15.3% +16.2%Digital 107 +30.2% +1649.0% +226.3%Live & Background 25 +7.4% +31.3% +96.4%Educational Use 2 -55.0% -51.9% -54.3%Mechanical Reproduction 0.3 -21.5% -93.9% -66.1%Other 31 +4.8% +29.8% +47.2%Private Copying 80 -10.3% +6.4% -30.9%Rental/Public Lending 3 +508.8% +268.2% +248.8%Reprography 2 +146.8% +1308.4% +292.1%Grand Total %u20ac727M +1.1% +32.6% +21.3%Digital audiovisual collections made up just 14.8% of total revenue in 2024, highlighting how traditional broadcast still dominates Tthe sector.dar anoiti Bloradcast 85.2%Digital 14.8%65.5% %u20ac476M 14.7% %u20ac107M 3.5% %u20ac25M 0.3% %u20ac2M 0.0% %u20ac0M 4.3% %u20ac31M 11.0% %u20ac80M 0.5% %u20ac3M 0.2% %u20ac2M CISAC Forewords CISAC AI Fraud Highlights Market analysis Futuresource Collections by repertoire Collections by region Tables of collections Membership About the report Methodology38 39Forewords CISAC AI Fraud Highlights Market analysis Futuresource Collections by repertoire Collections by region Tables of collections Membership About the report Methodology Global Collections Report
