


Page 19
P. 19
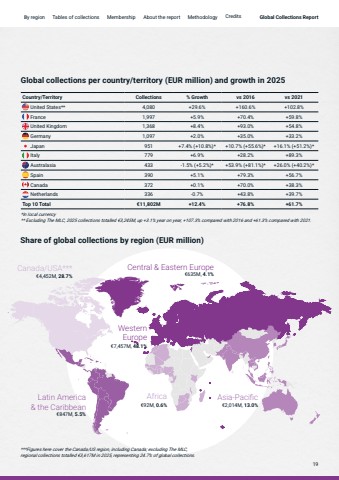
Share of global collections by region (EUR million)Western Europe%u20ac7,457M, 48.1%Canada/USA***%u20ac4,452M, 28.7%Latin America & the Caribbean%u20ac847M, 5.5%Africa%u20ac92M, 0.6%Asia-Pacific%u20ac2,014M, 13.0%Central & Eastern Europe %u20ac635M, 4.1%Country/Territory Collections % Growth vs 2016 vs 2021United States** 4,080 +29.6% +160.6% +102.8%France 1,997 +5.9% +70.4% +59.8%United Kingdom 1,368 +8.4% +93.0% +54.8%Germany 1,097 +2.0% +35.0% +33.2%Japan 951 +7.4% (+10.8%)* +10.7% (+55.6%)* +16.1% (+51.2%)*Italy 779 +6.9% +28.2% +89.3%Australasia 433 -1.5% (+5.2%)* +53.9% (+81.1%)* +26.0% (+40.2%)*Spain 390 +5.1% +79.3% +56.7%Canada 372 +0.1% +70.0% +38.3%Netherlands 336 -0.7% +43.8% +39.7%Top 10 Total %u20ac11,802M +12.4% +76.8% +61.7%Global collections per country/territory (EUR million) and growth in 2025*In local currency** Excluding The MLC, 2025 collections totalled %u20ac3,245M, up +3.1% year on year, +107.3% compared with 2016 and +61.3% compared with 2021.***Figures here cover the Canada/US region, including Canada; excluding The MLC, regional collections totalled %u20ac3,617M in 2025, representing 24.7% of global collections.Global Collections Report19


