
Page 9 - Demo
P. 9
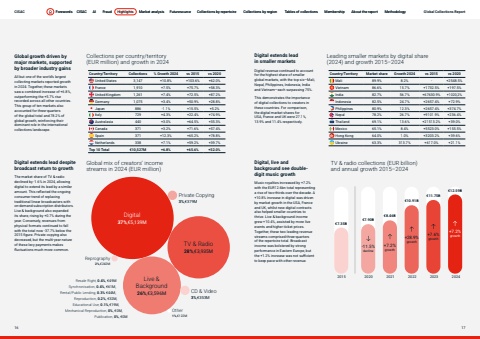
Page titleStandfirstBodyGlobal growth driven by major markets, supported by broader industry gainsAll but one of the world%u2019s largest collecting markets reported growth in 2024. Together, these markets saw a combined increase of +6.8%, outperforming the +5.7% rise recorded across all other countries. This group of ten markets also accounted for three-quarters of the global total and 78.2% of global growth, reinforcing their dominant role in the international collections landscape.Digital extends lead in smaller marketsDigital revenue continued to account for the highest share of smaller global markets, with the top six%u2014Mali, Nepal, Philippines, Indonesia, India and Vietnam%u2014each surpassing 75%.This demonstrates the importance of digital collections to creators in these countries. For comparison, the digital market shares for USA, France and UK were 27.1%, 13.9% and 11.4% respectively. Country/Territory Collections % Growth 2024 vs 2015 vs 2020United States 3,147 +10.8% +103.6% +62.0%France 1,910 +7.5% +75.7% +58.3%United Kingdom 1,261 +7.4% +72.5% +87.2%Germany 1,075 +3.4% +50.9% +28.8%Japan 886 -1.1% +15.5% +5.2%Italy 729 +4.3% +22.4% +74.9%Australasia 440 +3.0% +64.5% +35.3%Canada 371 +3.2% +71.6% +57.4%Spain 371 +12.3% +65.2% +78.8%Netherlands 338 +7.1% +59.2% +39.7%Top 10 Total %u20ac10,527M +6.8% +65.6% +52.0%Country/Territory Market share Growth 2024 vs 2015 vs 2020Mali 89.9% 8.2% - +2548.5%Vietnam 86.6% 15.7% +1732.5% +197.5%India 82.7% 56.7% +67630.9% +1020,2%Indonesia 82.5% 24.7% +2657.4% +72.9%Philippines 80.9% 12.3% +2657.4% +374.7%Nepal 78.2% 26.7% +9101.9% +236.4%Thailand 69.1% 13.6% +21513.2% +39.0%Mexico 65.1% 8.4% +5523.0% +155.5%Hong Kong 64.0% 1.0% +3203.2% +39.6%Ukraine 63.3% 313.7% +617.0% +21.1%Collections per country/territory (EUR million) and growth in 2024Leading smaller markets by digital share (2024) and growth 2015%u20132024 Global mix of creators%u2019 income streams in 2024 (EUR million)Digital extends lead despite broadcast return to growthThe market share of TV & radio declined by -1.6% in 2024, allowing digital to extend its lead by a similar amount. This reflected the ongoing consumer trend of replacing traditional linear broadcasters with on-demand subscription distributors. Live & background also expanded its share, rising by +0.7% during the year. Conversely, revenues from physical formats continued to fall with the total now -37.7% below the 2015 figure. Private copying also decreased, but the multi-year nature of these levy payments makes fluctuations much more common.Resale Right, 0.4%, %u20ac49MSynchronisation, 0.4%, %u20ac61M, Rental/Public Lending, 0.3% %u20ac44M, Reproduction, 0.2%, %u20ac32M, Educational Use, 0.1%,%u20ac19M, Mechanical Reproduction, 0%, %u20ac0M,Publication, 0%, %u20ac0M2015 2020 2021 2022 2023 2024%u20ac7.35B%u20ac8.46B%u20ac11.75B%u20ac7.90B%u20ac10.91B%u20ac12.59B-11.5%decline+28.9%growth+7.2%growth+7.6%growth+7.2%growthTV & radio collections (EUR billion) and annual growth 2015%u20132024Digital, live and background see doubledigit music growthMusic royalties increased by +7.2% with the EUR12.6bn total representing a rise of two-thirds over the decade. A +10.8% increase in digital was driven by market growth in the USA, France and UK, whilst new digital contracts also helped smaller countries to thrive. Live & background income grew +10.4%, assisted by more live events and higher ticket prices. Together, these two leading revenue streams comprised three-quarters of the repertoire total. Broadcast income was bolstered by strong performance in Eastern Europe, but the +1.2% increase was not sufficient to keep pace with other revenue. Digital37%,%u20ac5,139MTV & Radio28%,%u20ac3,935MLive & Background26%,%u20ac3,596MPrivate Copying3%,%u20ac379MCD & Video3%,%u20ac353MReprography2%,%u20ac242MOther1%,%u20ac122MCISAC Forewords CISAC AI Fraud Highlights Market analysis Futuresource Collections by repertoire Collections by region Tables of collections Membership About the report Methodology16 17Forewords CISAC AI Fraud Highlights Market analysis Futuresource Collections by repertoire Collections by region Tables of collections Membership About the report Methodology Global Collections Report
